Communication
Image

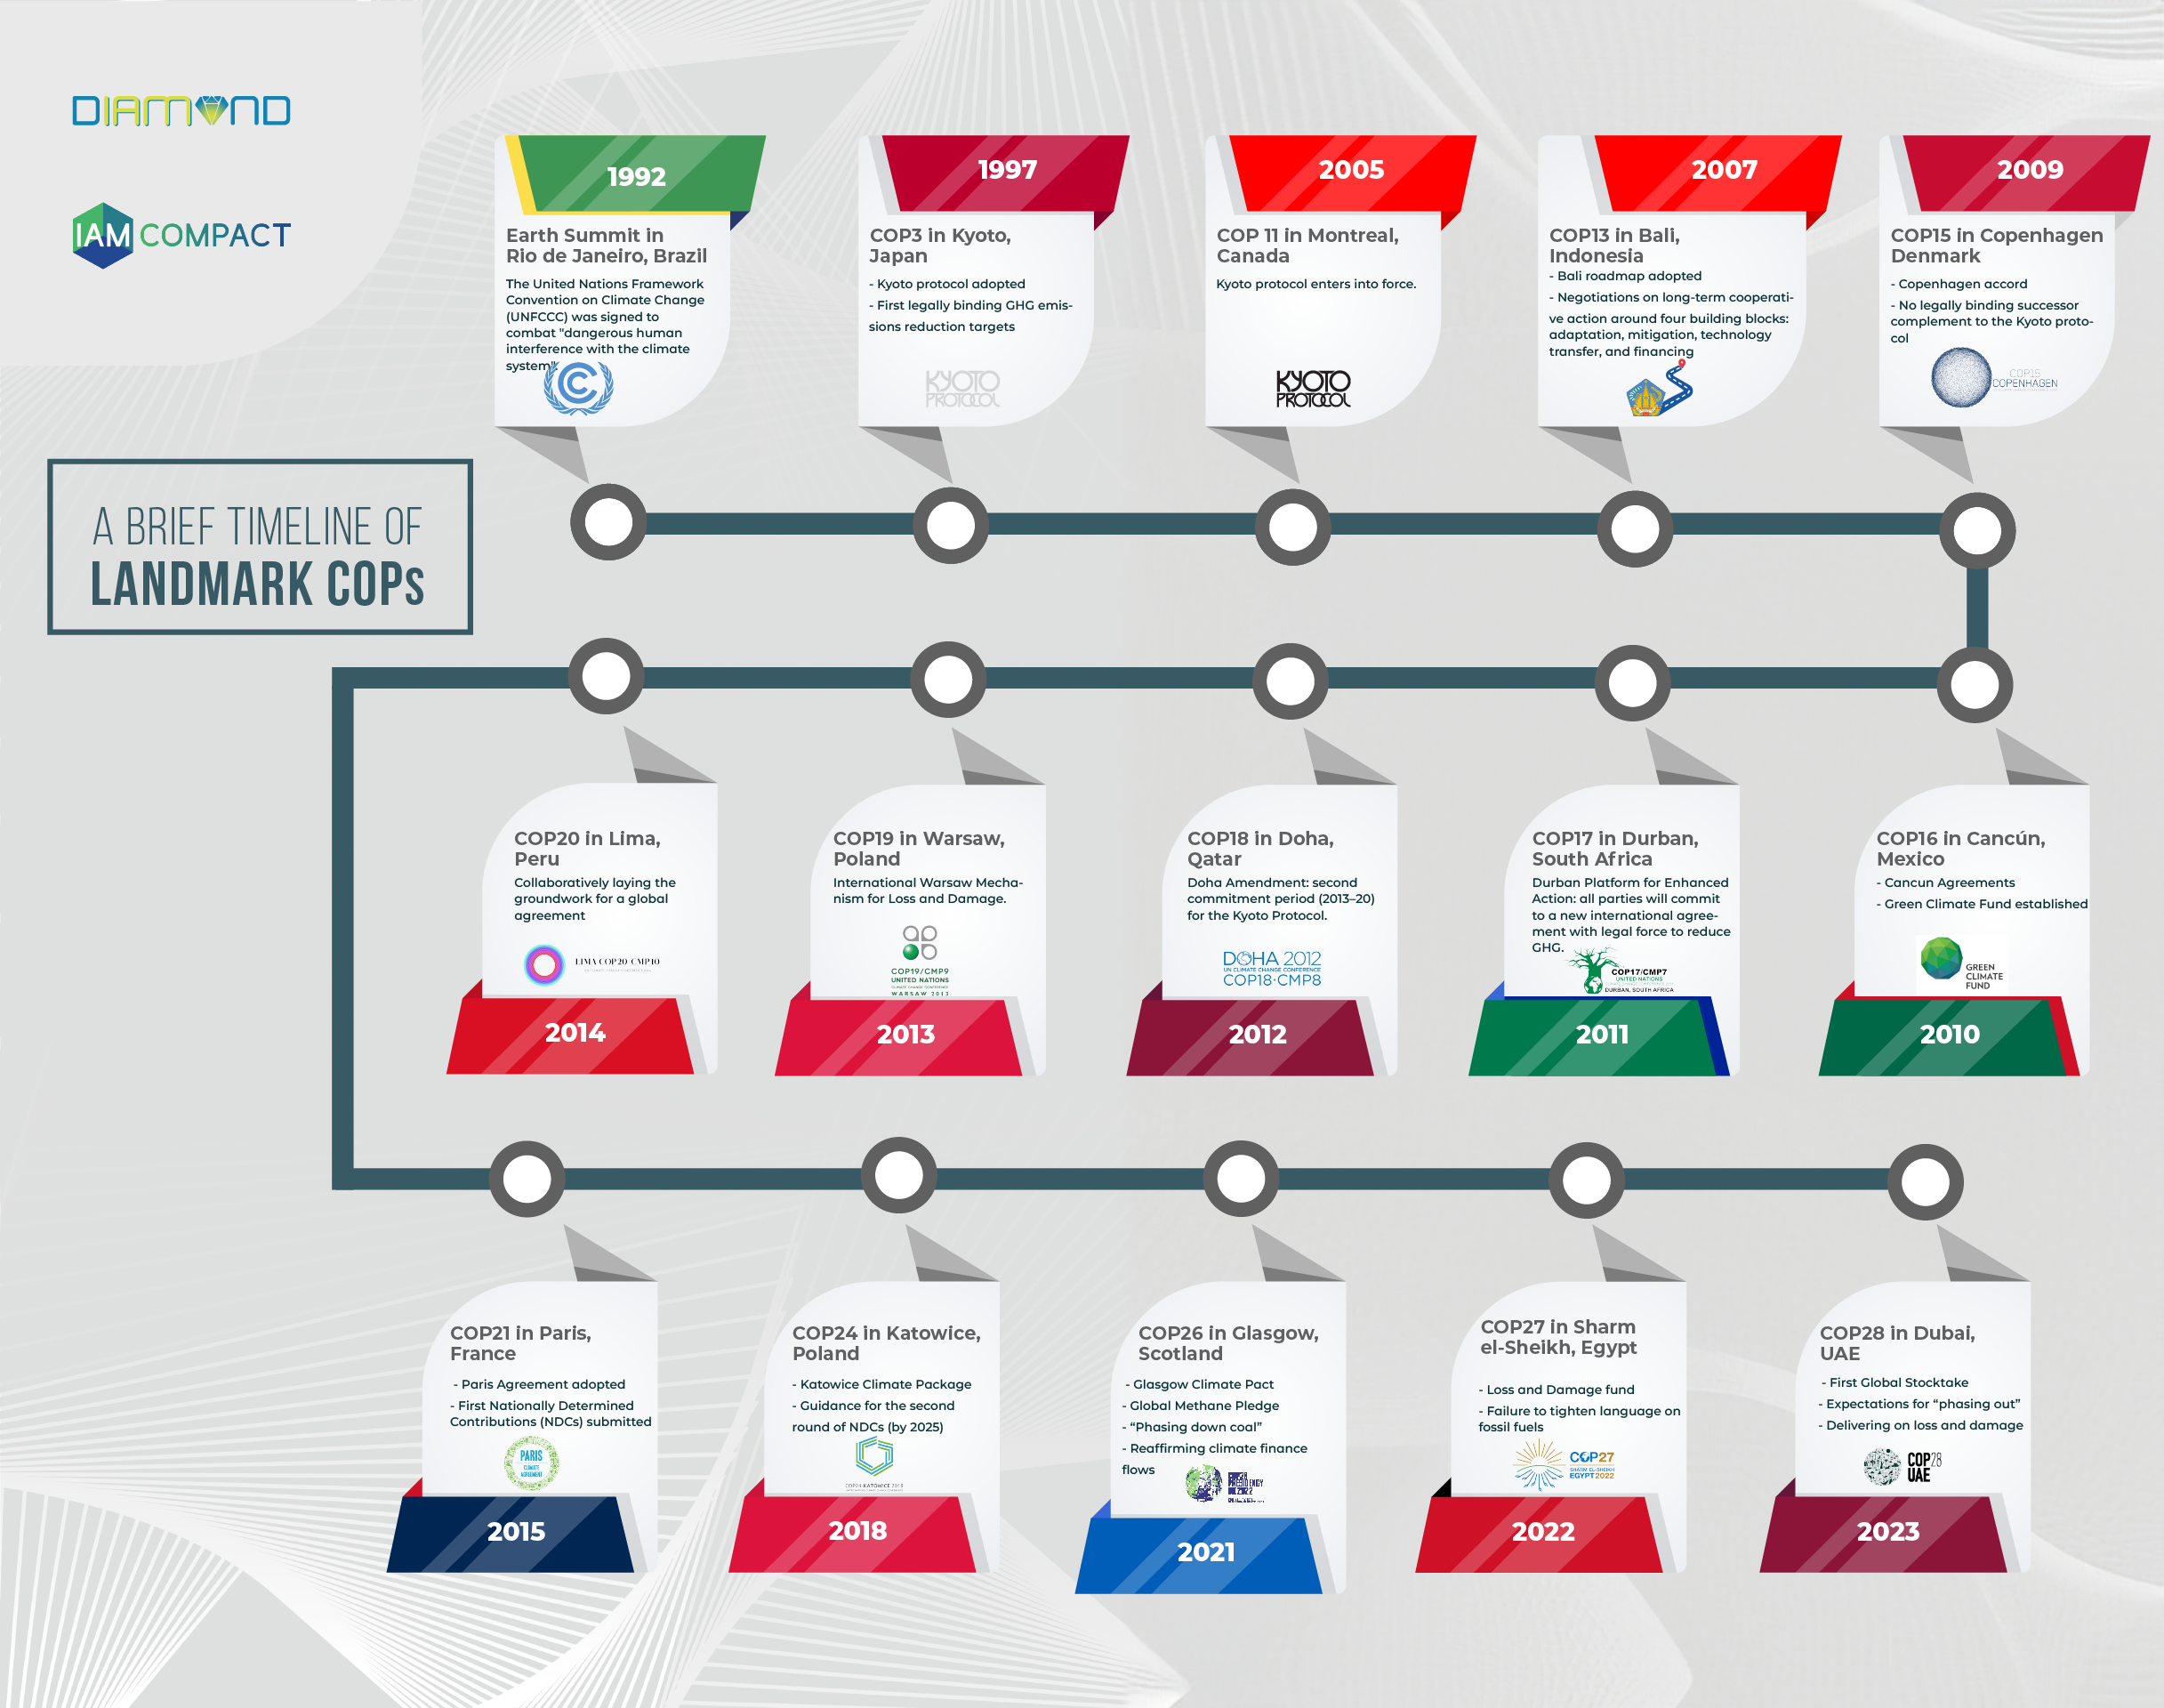
November 2023: A timeline of landmark COPs
What to expect in COP28? An infographic co-created with the DIAMOND project
Image
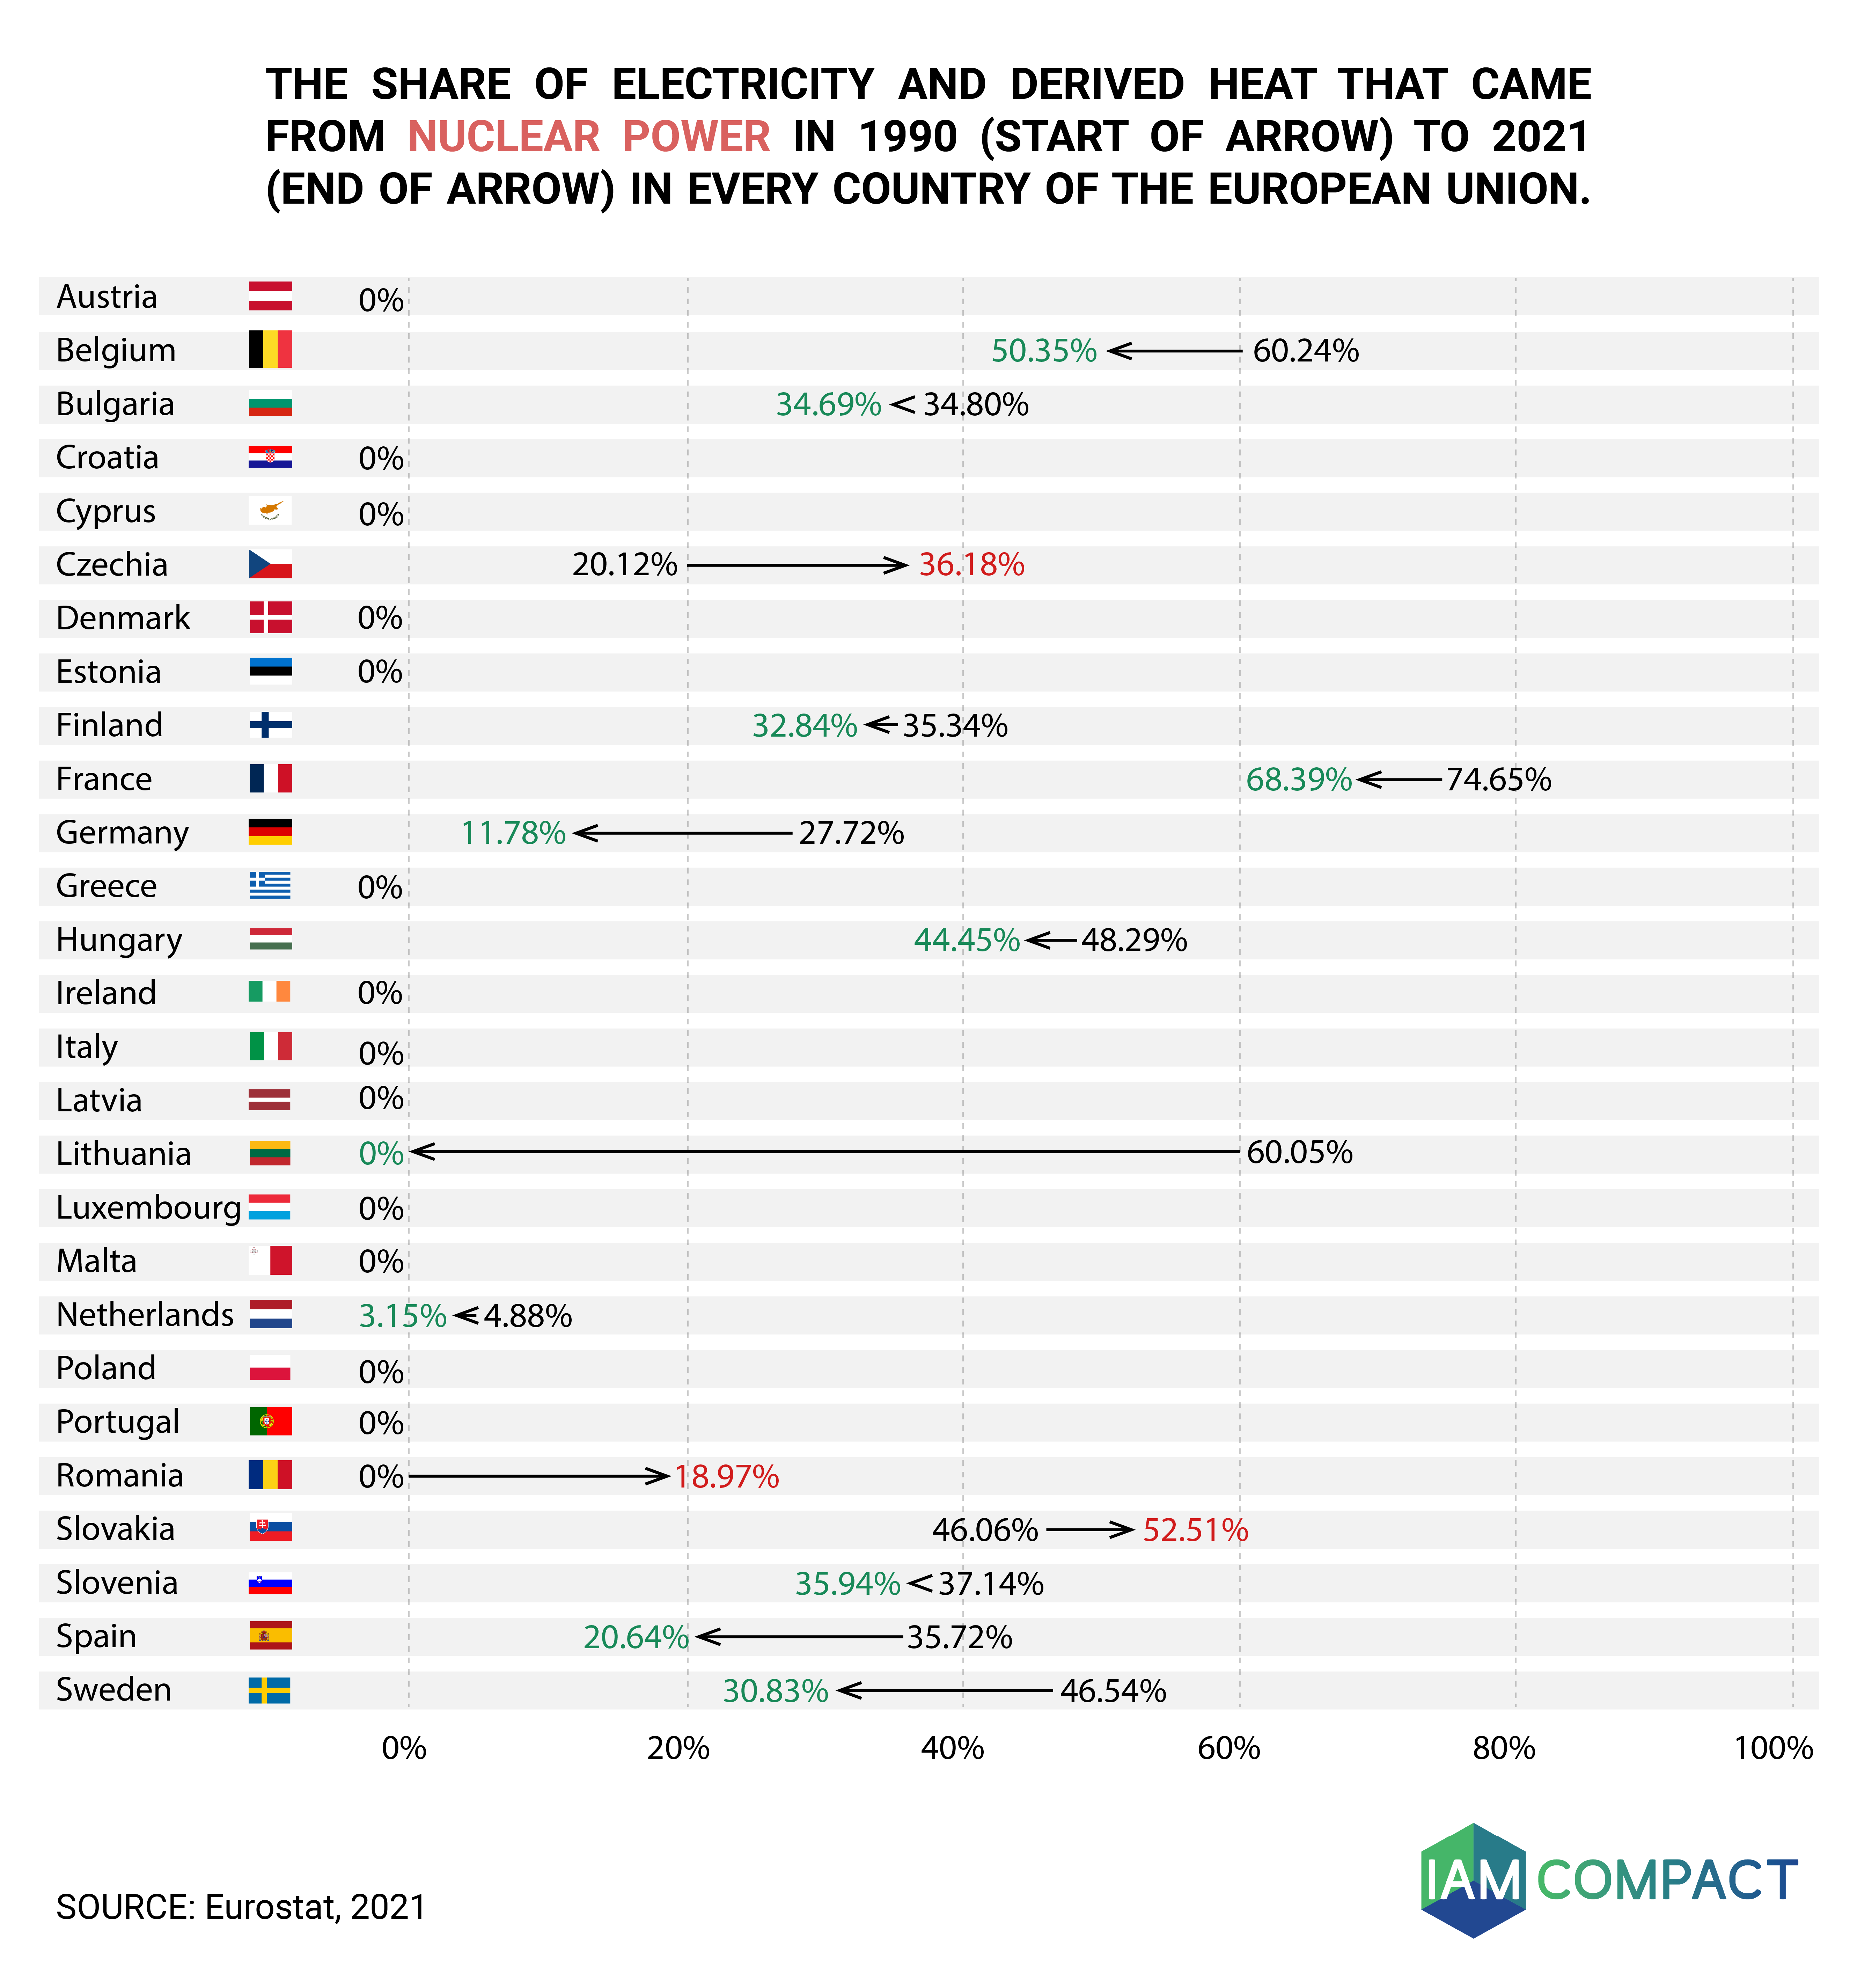
October 2023: Evolution of nuclear in the EU
Changes in nuclear power (since 1990) in each of the 27 EU Member States
Image
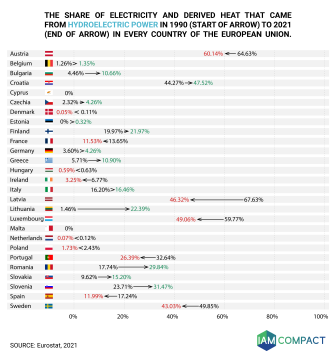
September 2023: Evolution of hydro in the EU
Changes in hydropower share (since 1990) in each of the 27 EU Member States
Image

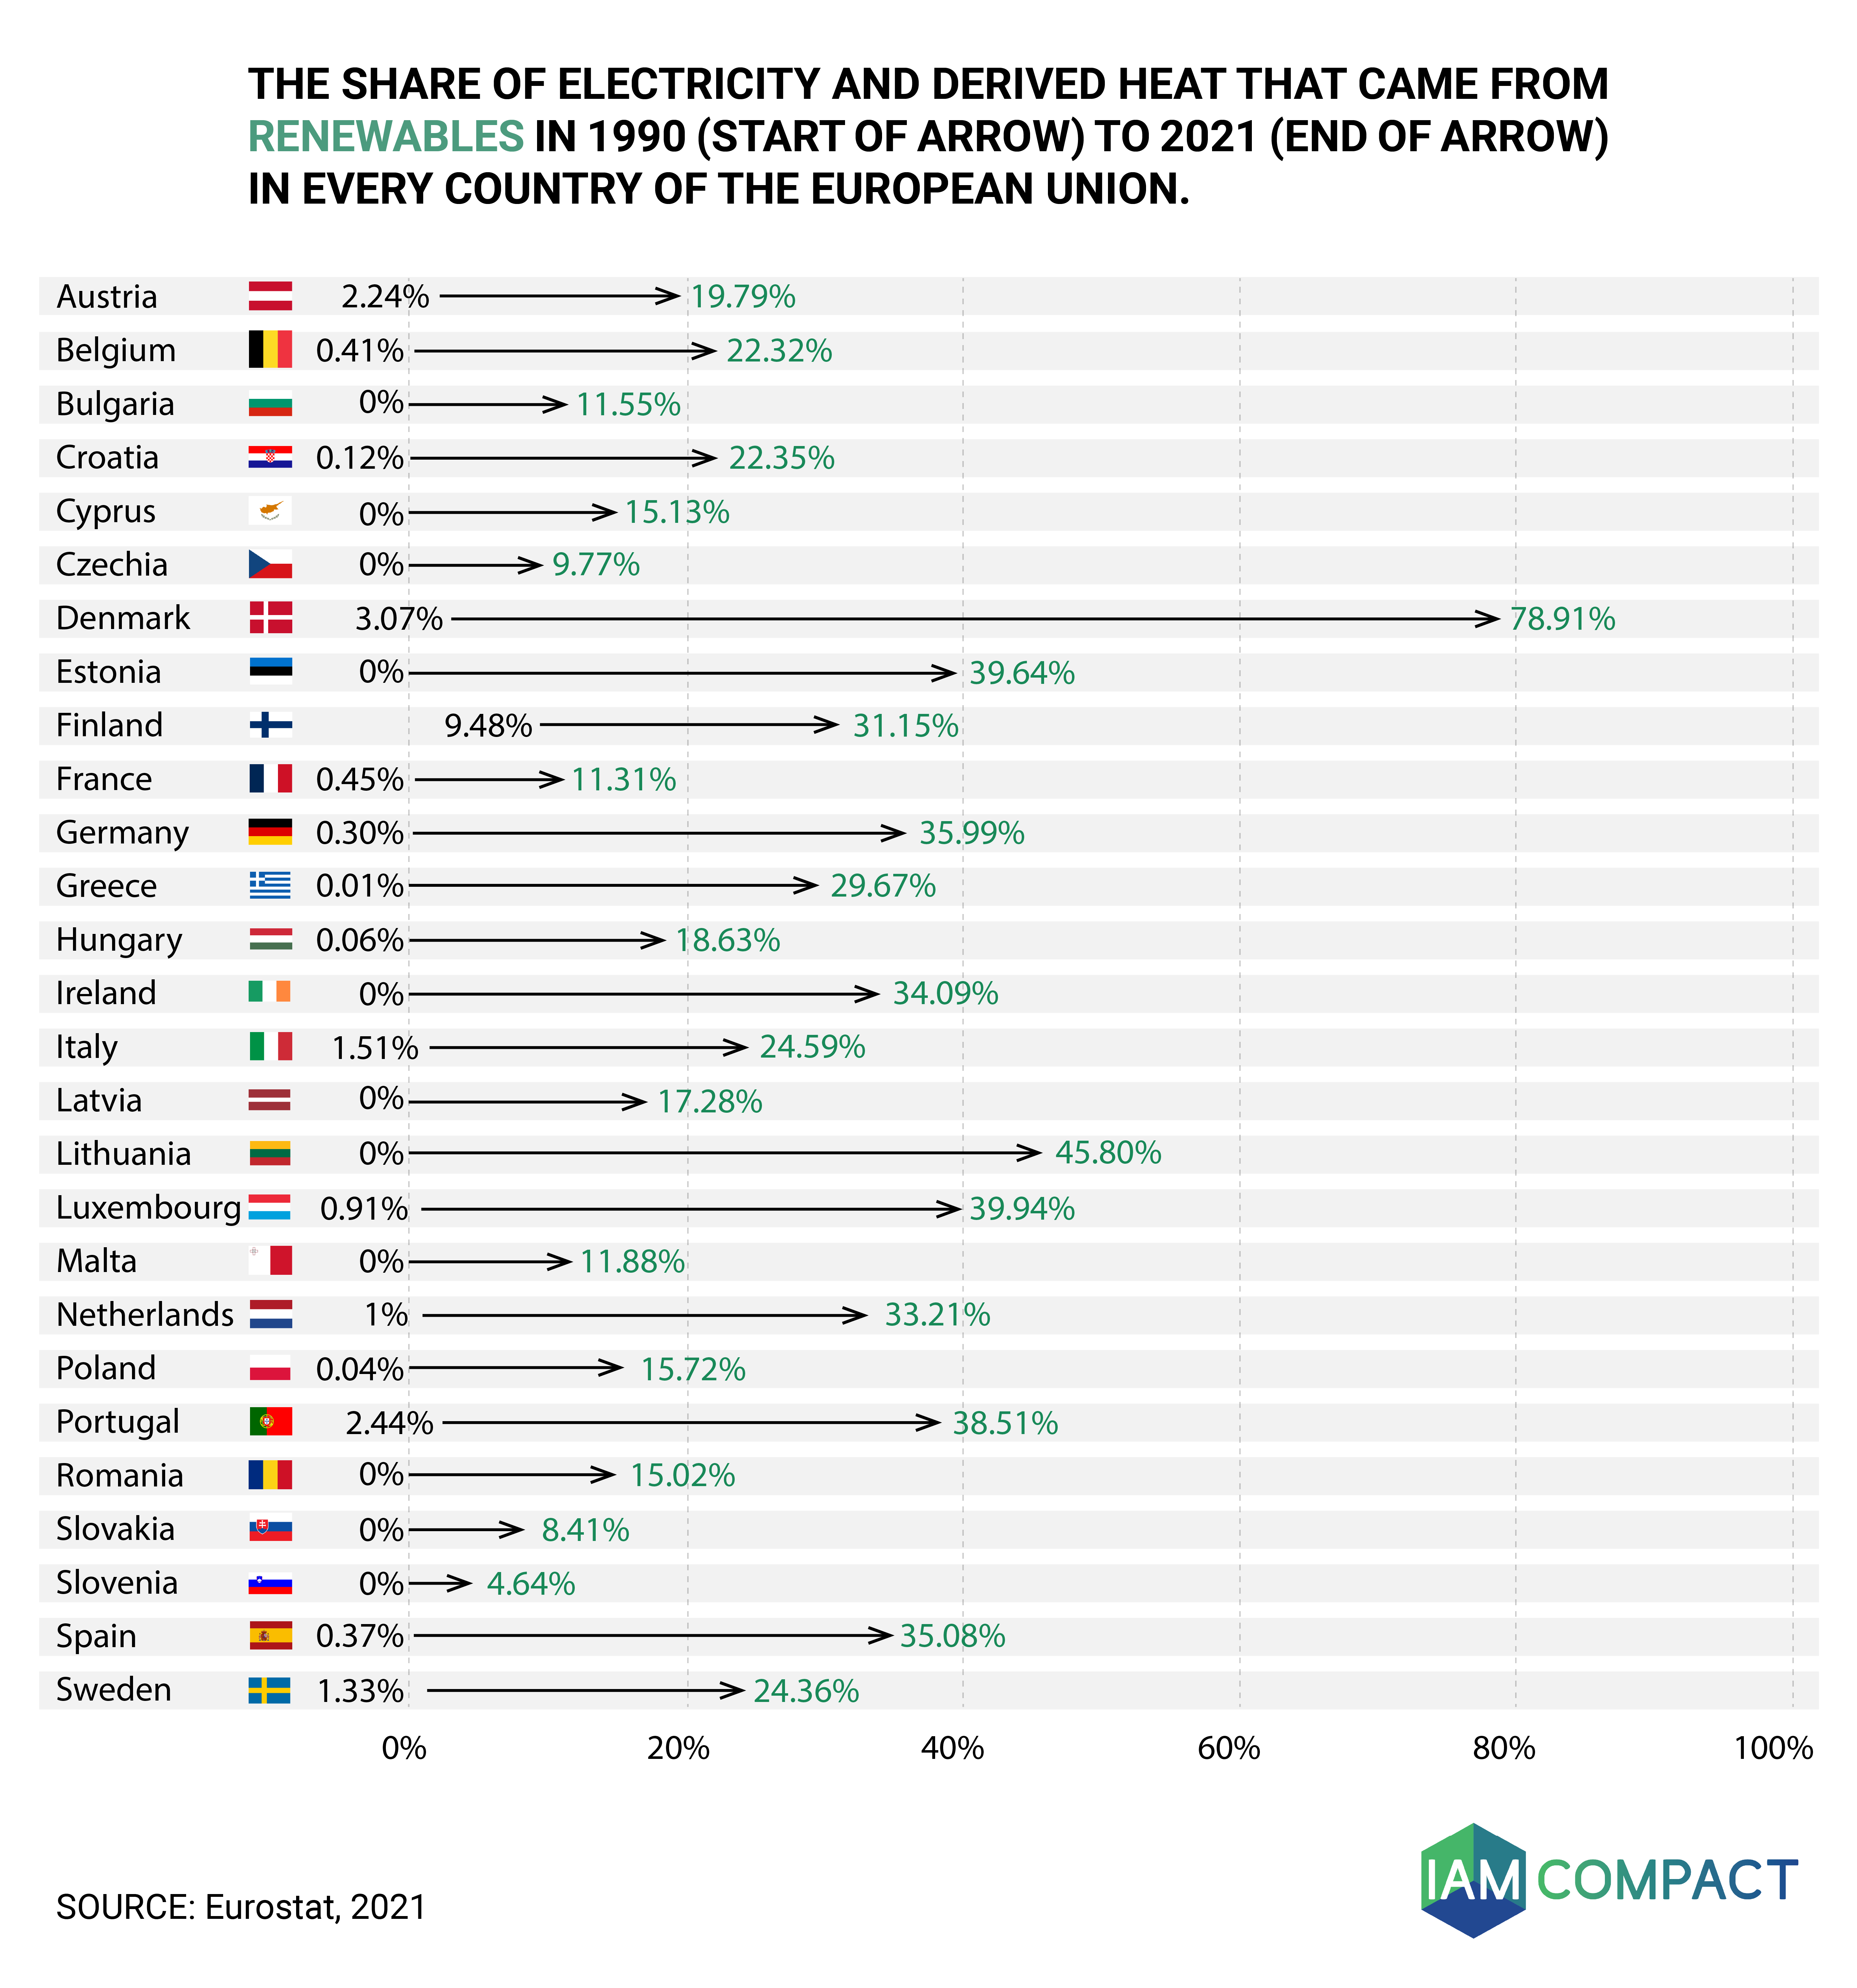
June 2023: Evolution of RES in the EU
Changes in RES share (since 1990) in each of the 27 EU Member States
Image
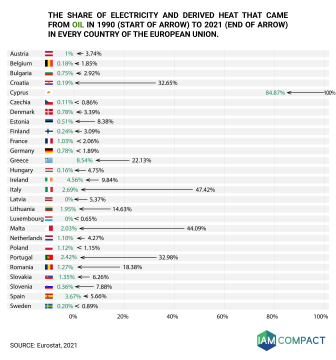
May 2023: Evolution of oil in the EU
Changes in oil share (since 1990) in each of the 27 EU Member States
Image
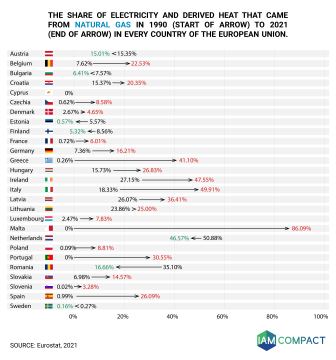
April 2023: Evolution of natural gas in the EU
Changes in natural gas share (since 1990) in each of the 27 EU Member States
Image

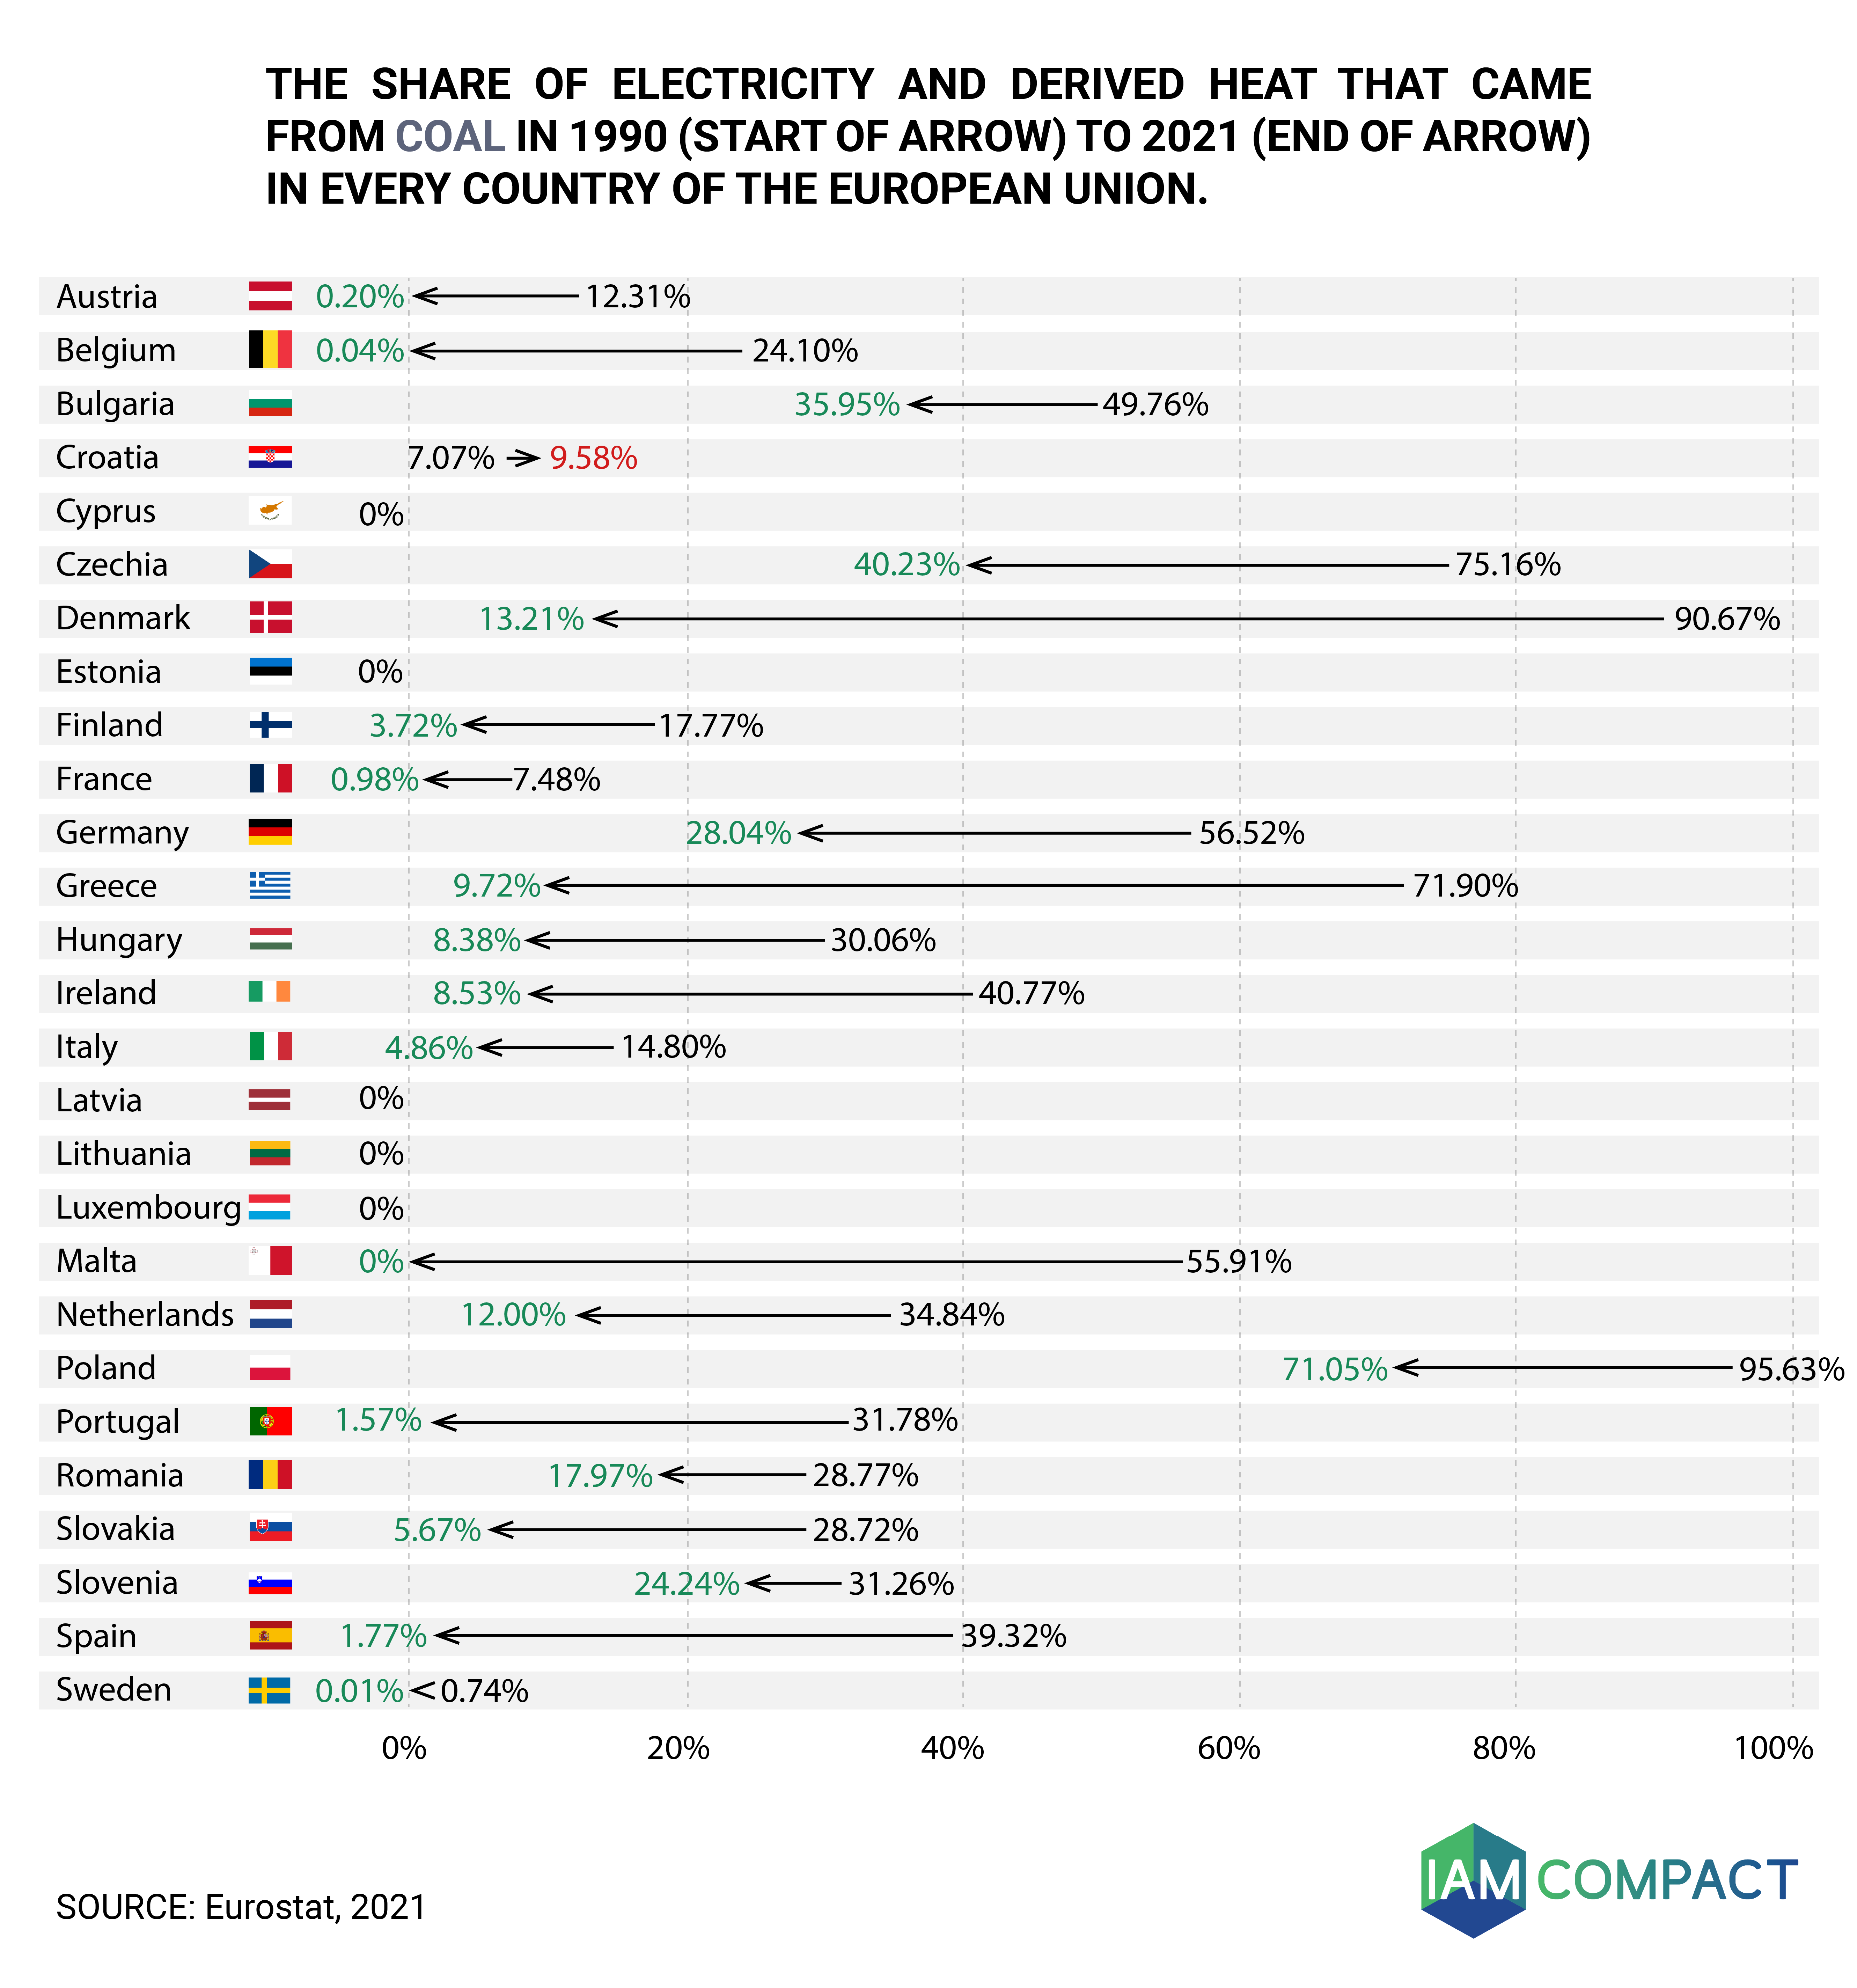
March 2023: Evolution of coal in the EU
Changes in coal share (since 1990) in each of the 27 EU Member States
Image
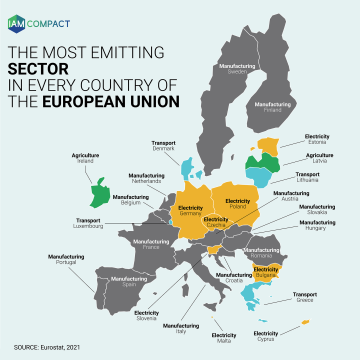
February 2023: Highest emitting sector in the EU
The highest emitting sector in each of the 27 EU Member States
Image
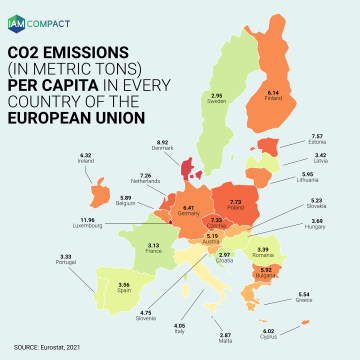
January 2023: CO2 emissions per capita in the EU
CO2 emissions per capita (in metric tons) in a heatmap of the EU-27
Image
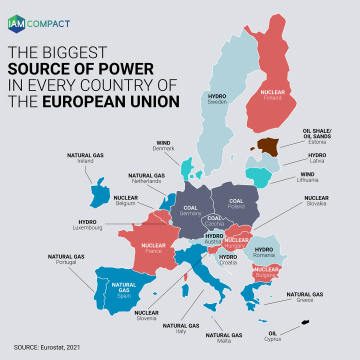
December 2022: Biggest power source in the EU
The biggest source of electricity in each of the 27 EU Member States